 Image 1 of 9
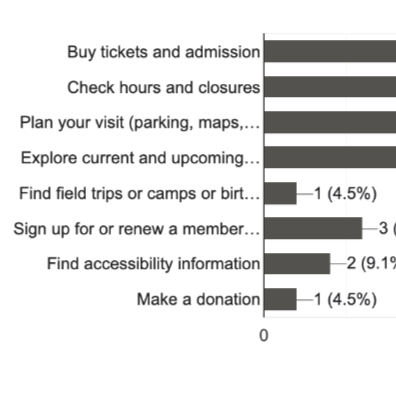 Image 2 of 9
 Image 3 of 9
 Image 4 of 9
 Image 5 of 9
 Image 6 of 9
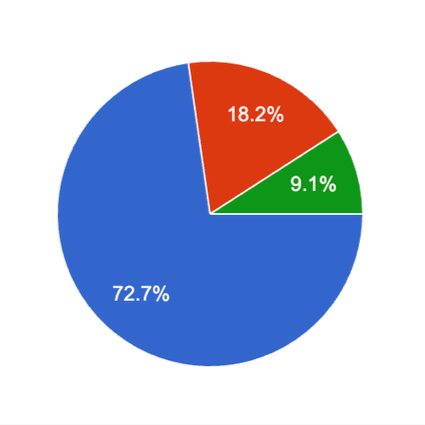 Image 7 of 9
 Image 8 of 9
 Image 9 of 9
PROCESS & DECISIONS
The research process included several key components:
Heuristic Evaluation: Assessed the website using Nielsen's 10 usability heuristics.
Accessibility Audit: Evaluated accessibility concerns using digital assessment tools.
Survey Research: Developed survey questions and analyzed user feedback.
Usability Testing: Evaluated task completion, navigation difficulties, errors, and ease of use.
SUS Analysis: Calculated usability scores to assess the overall user experience.
Recommendations: Identified opportunities to improve navigation, accessibility, and usability.
MY CONTRIBUTION
I conducted UX research using heuristic evaluations, accessibility testing, surveys, and structured usability testing. I analyzed user interactions, documented usability issues, and evaluated task performance to identify opportunities for improvement.
KEY TAKEAWAYS
This project strengthened my skills in UX research, accessibility evaluation, usability testing, and data analysis. It demonstrated how combining qualitative observations with quantitative results can support informed design decisions and create more accessible, user-friendly digital experiences.
Research Methods & Usability Evaluation
Usability Testing and Reflection
Heuristic Evaluation – Nielsen’s 10 Usability Heuristics & Accessibility Audit
Survey Data Collection & Analysis
Arizona Science Center (Responses)
Persona Creation
Actionable insights: Strategic Survey Metrics
Demographics & Participant Overview
Young Adult Majority: 50.0% of respondents (29 of 58) are in the 18–25 age range, followed by 22.4% (13 of 58) in the 26–35 category, and 8.6% each in the 36–45, 46–55, and 55+ age brackets.
Female Representation: 82.8% of survey participants (48 out of 58) identify as women, while 17.2% (10 out of 58) identify as men.
Highly Educated Sample: 48.3% of participants (28 out of 58) hold or are pursuing an undergraduate degree, while 44.8% (26 out of 58) have graduate-level education.
Geographic Distribution: The audience is split almost evenly between out-of-state visitors at 46.6% (27 out of 58) and local Phoenix Metropolitan Area residents at 44.8% (26 out of 58).
Baseline Brand Familiarity & Awareness
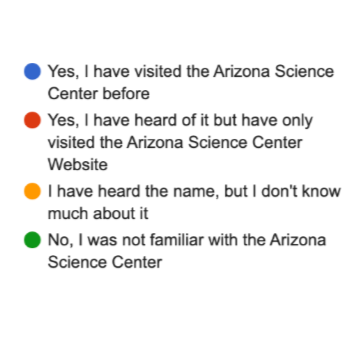
High Unfamiliarity: 48.3% of respondents (28 out of 58) were completely unfamiliar with the Arizona Science Center before taking the survey.
Past Visitors: 22.4% of participants (13 out of 58) have physically visited the science center in person.
Digital-Only Knowledge: 15.5% of respondents (9 out of 58) have heard of the center and visited its website, while 13.8% (8 out of 58) have heard the name but know little about it.
Digital Touchpoints & Primary Web Tasks
Mobile-Dominant Access: 72.7% of evaluated respondents (16 out of 22) prefer visiting the website using a smartphone, compared to 18.2% on laptops (4 out of 22) and 9.1% on tablets (2 out of 22).
Core Action Priorities: When visiting the website, 81.8% of users (18 out of 22) want to buy tickets and admission, 72.7% (16 out of 22) want to check hours and closures, 63.6% (14 out of 22) aim to explore current/upcoming events, and 45.5% (10 out of 22) look to plan visit logistics like parking and maps.
Secondary Actions: Low-intent activities include renewing memberships (13.6%, 3 out of 22), seeking accessibility information (9.1%, 2 out of 22), making donations (4.5%, 1 out of 22), and finding field trips/camps (4.5%, 1 out of 22).
Usability Evaluation & Must-Have Web Features
Critical Website Attributes: 81.8% of users (18 out of 22) rate easy navigation as "Very Important," 77.3% (17 out of 22) rate transparent ticket prices as "Very Important," and 59.1% (13 out of 22) rate clear operating hours as "Very Important."
Top 3 Desired Features: Simple navigation is the top essential feature selected by 68.2% of users (15 out of 22), followed by easy ticket purchasing at 45.5% (10 out of 22) and photos/visuals at 36.4% (8 out of 22).
High Content & Design Satisfaction: 45.5% of users (10 out of 22) found the site content "Very clear" and 36.4% (8 out of 22) found it "Somewhat Clear," while 72.7% (16 out of 22) moderately liked the overall visual design.
Overall Experience: 54.5% of users (12 out of 22) rated their website experience a 5.0 out of 5.0, while 45.5% (10 out of 22) rated it a 4.0 out of 5.0.
Companion Group Dynamics & Outing Behaviors
Social Outing Context: 41.4% of respondents (24 out of 58) visit science centers with friends, 37.9% (22 out of 58) visit with a partner/spouse, 29.3% (17 out of 58) visit with extended family, and 25.9% (15 out of 58) visit with children.
Flexible Planning Style: 68.4% of respondents (13 out of 19) research key details ahead of time while keeping parts of their visit open-ended, whereas 31.6% (6 out of 19) strictly plan out their schedule in advance.
Research Recruitment: 27.6% of survey respondents (16 out of 58) opted in for future user research opportunities.
Qualitative User Sentiment & Open Feedback
Hopes & Intended Accomplishments:
Users visit the website primarily to check exhibit dates, compare ticket packages, confirm operating hours, and organize group outings with family or friends.
Visitors seek immediate visual previews of current planetarium shows, featured exhibits, and hands-on historical attractions.
Friction Points & Ambiguities:
Pricing structures feel ambiguous to visitors when trying to determine what specific exhibits and activities are included with general admission versus add-on tickets.
User-Suggested Improvements:
Implement direct homepage links to explore all exhibits quickly without searching through sub-menus.
Add short visible summaries for events directly on listing pages to avoid forcing users to click into separate detailed pages.
Relocate donation options closer to primary call-to-action buttons like ticket purchasing and add flexible payment methods.
Modernize the website color palette to better align with a contemporary science center aesthetic.
Strategic Recommendations
Optimize for Mobile First: Redesign ticket checkout and exhibit schedule pages specifically for smartphone viewports to support the 72.7% mobile user base.
Clarify Tiered Pricing: Add an explicit breakdown chart on the ticket page detailing exactly what each admission tier includes before checkout.
Streamline Homepage Navigation: Provide single-click access from the main banner to current and upcoming exhibit listings and daily schedule highlights.
Enhance Exhibit Snippets: Add short, 2-sentence synopses directly on event cards so visitors don’t have to click through to scan activities.
Chart Insights
The chart titled Familiarity by Residency reveals a strong correlation between location and brand familiarity: 46.2% of local Phoenix Metropolitan Area residents have physically visited the center, whereas 74.1% of out-of-state respondents have no prior familiarity with the Arizona Science Center.